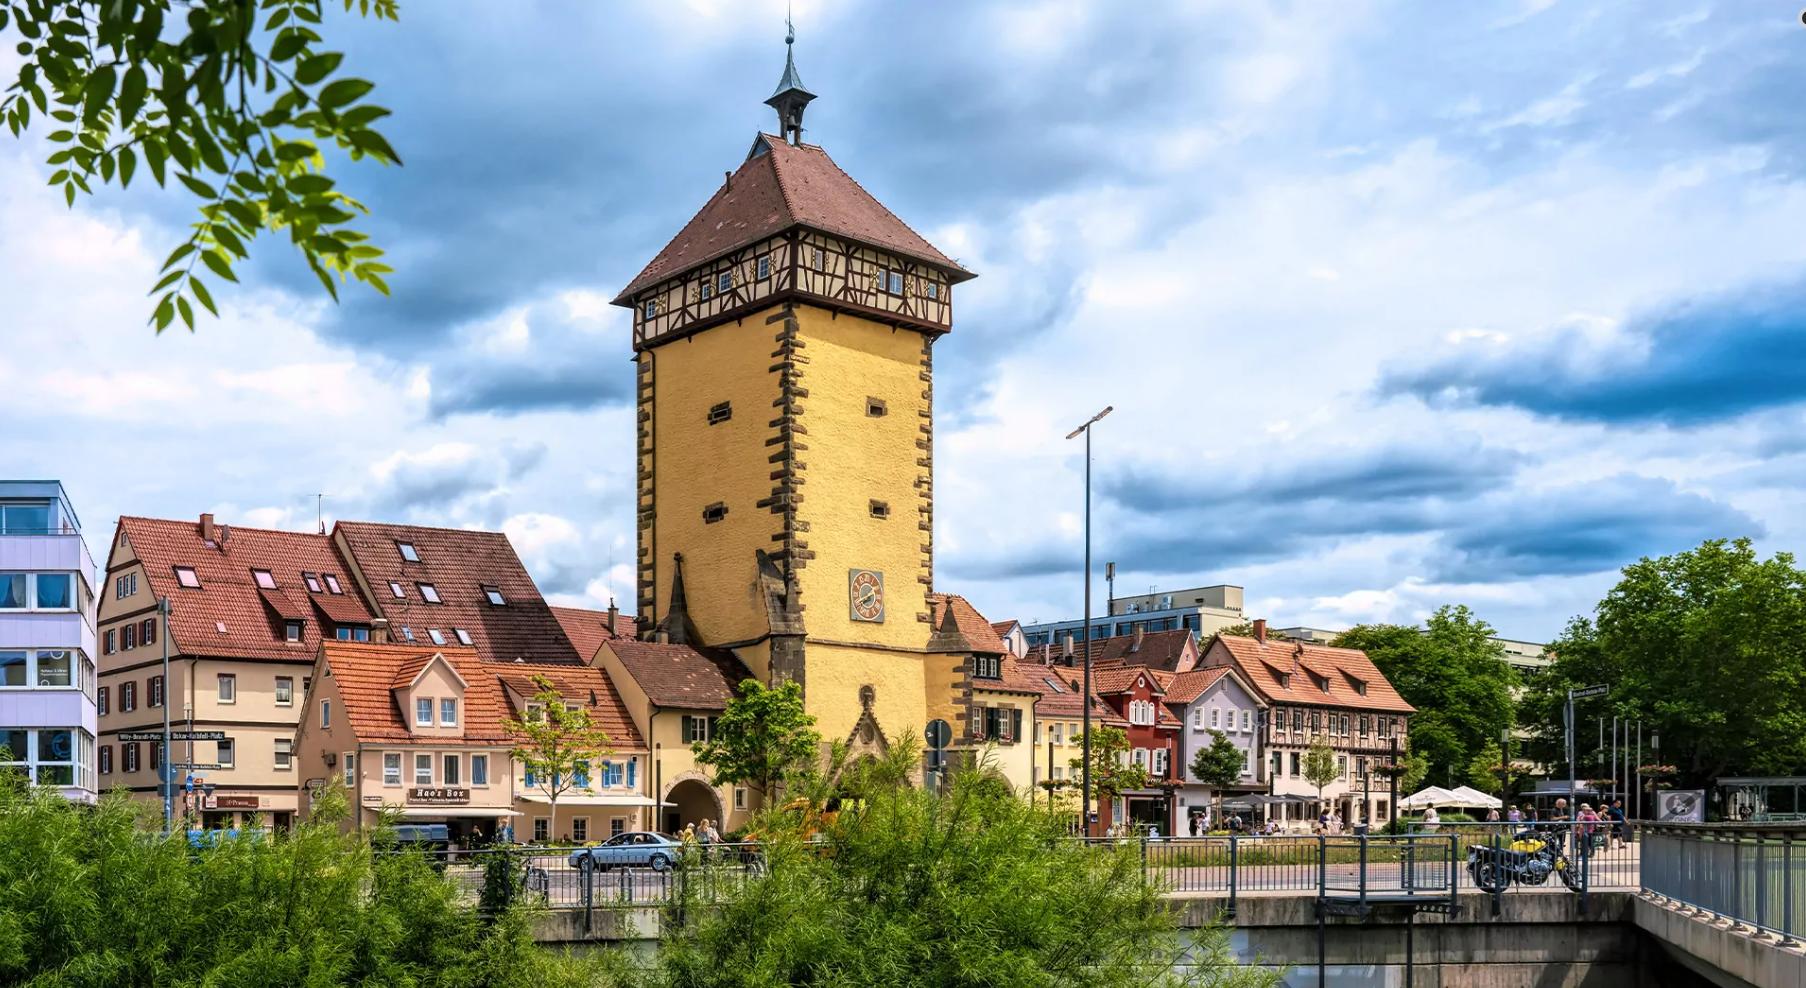
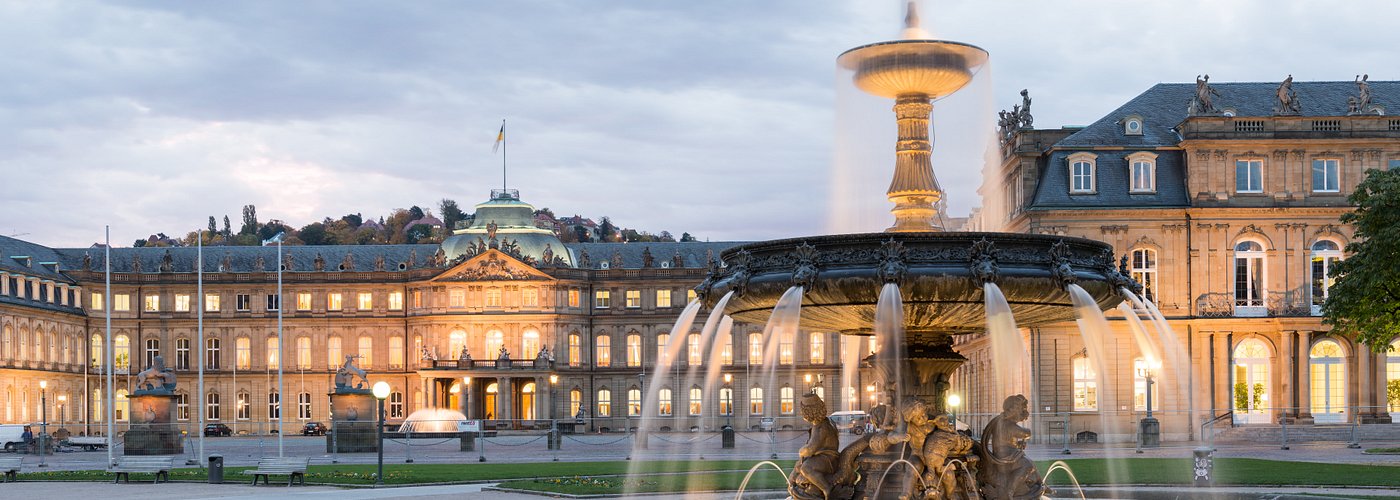
Hi, I’m Luke, or more formally Lukas. I’m a German national with dual citizenship in the US. I was born in Wisconsin, USA but grew up in the greater Stuttgart area (Germany), which is known for its car industry and the Swabian dialect.
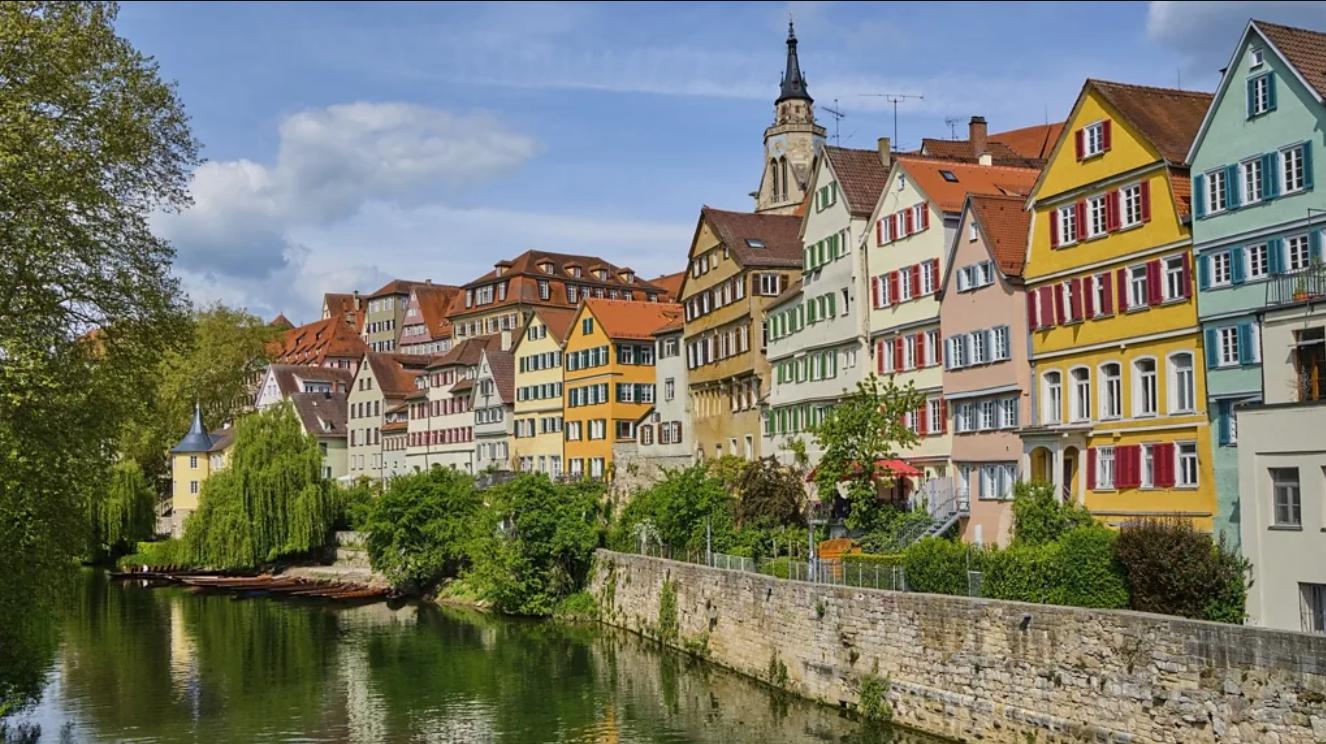
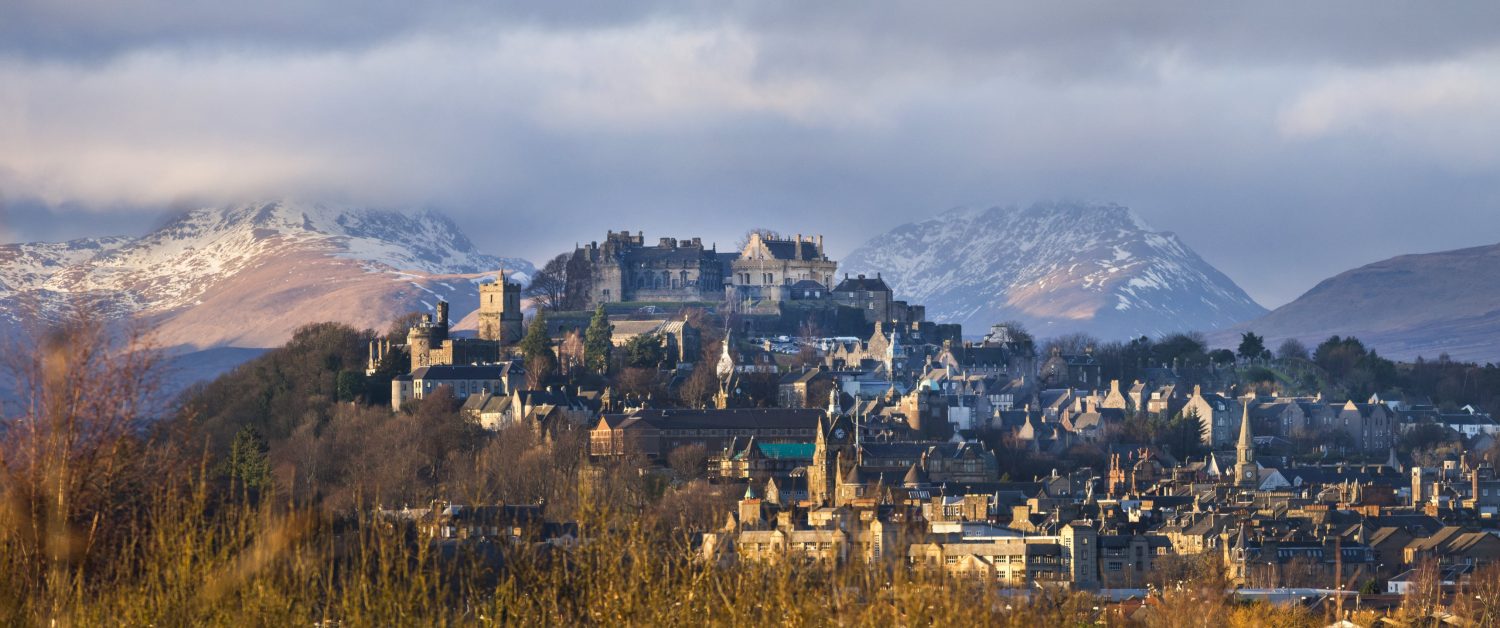
After a brief stint working in a closed psychiatric ward at my local university hospital in Tübingen, I decided to pursue undergraduate education at a small university in beautiful Scotland.
Despite my initial ambitions to pursue a career in clinical psychology, I discovered my analytical side when I was introduced to computer programming by a PhD student in the lab I was helping out in. I got very lucky in this regard as just prior to graduating, I was offered a summer internship at a London-based Data-Science consultancy. I enjoyed the work as it offered diverse problems to solve from different clients, but ultimately I felt that I should also seek formal education in data analytics.
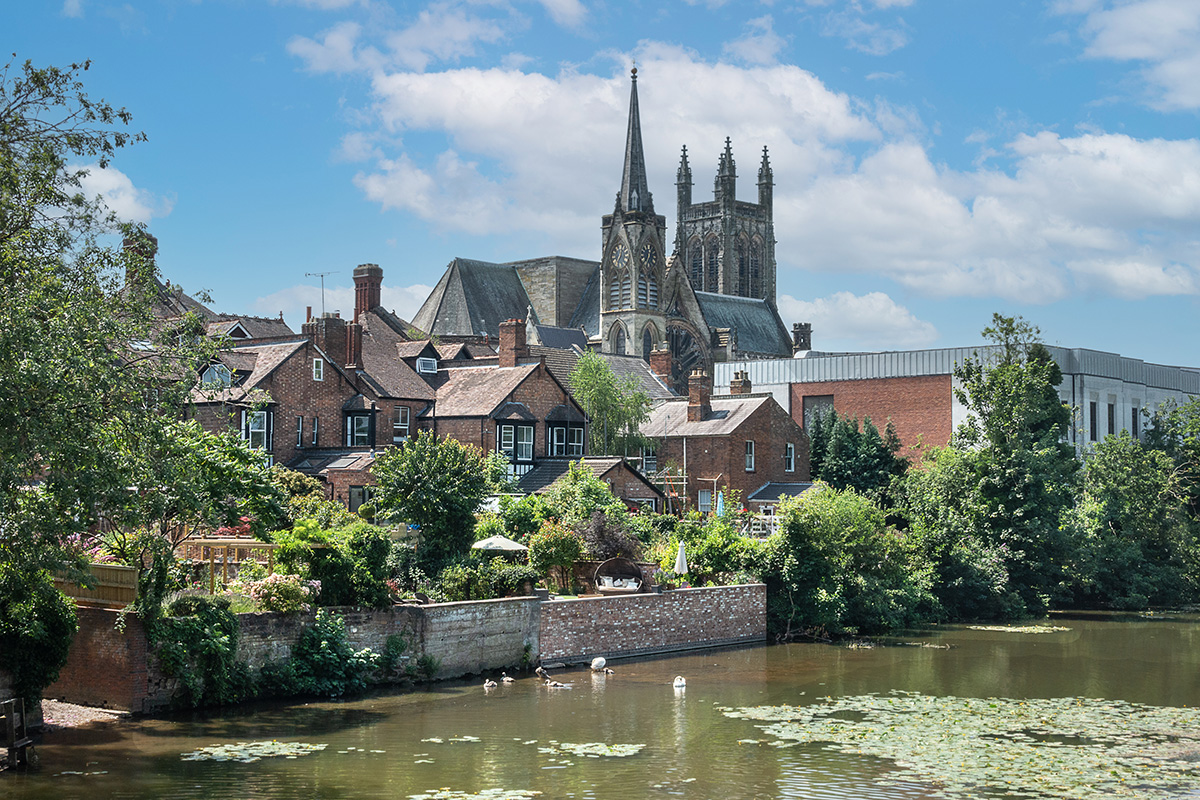
The Behavioral and Data Science M.Sc. at the University of Warwick was very much the perfect fit for me, as it combined my interest in behavioral research with my newfound passion for select topics in Computer Science. It was at Warwick where I first came to appreciate the application of computational modelling to describe cognitive processes. This was when things “clicked” in my head, and I knew that I wanted to pursue a PhD in this area.
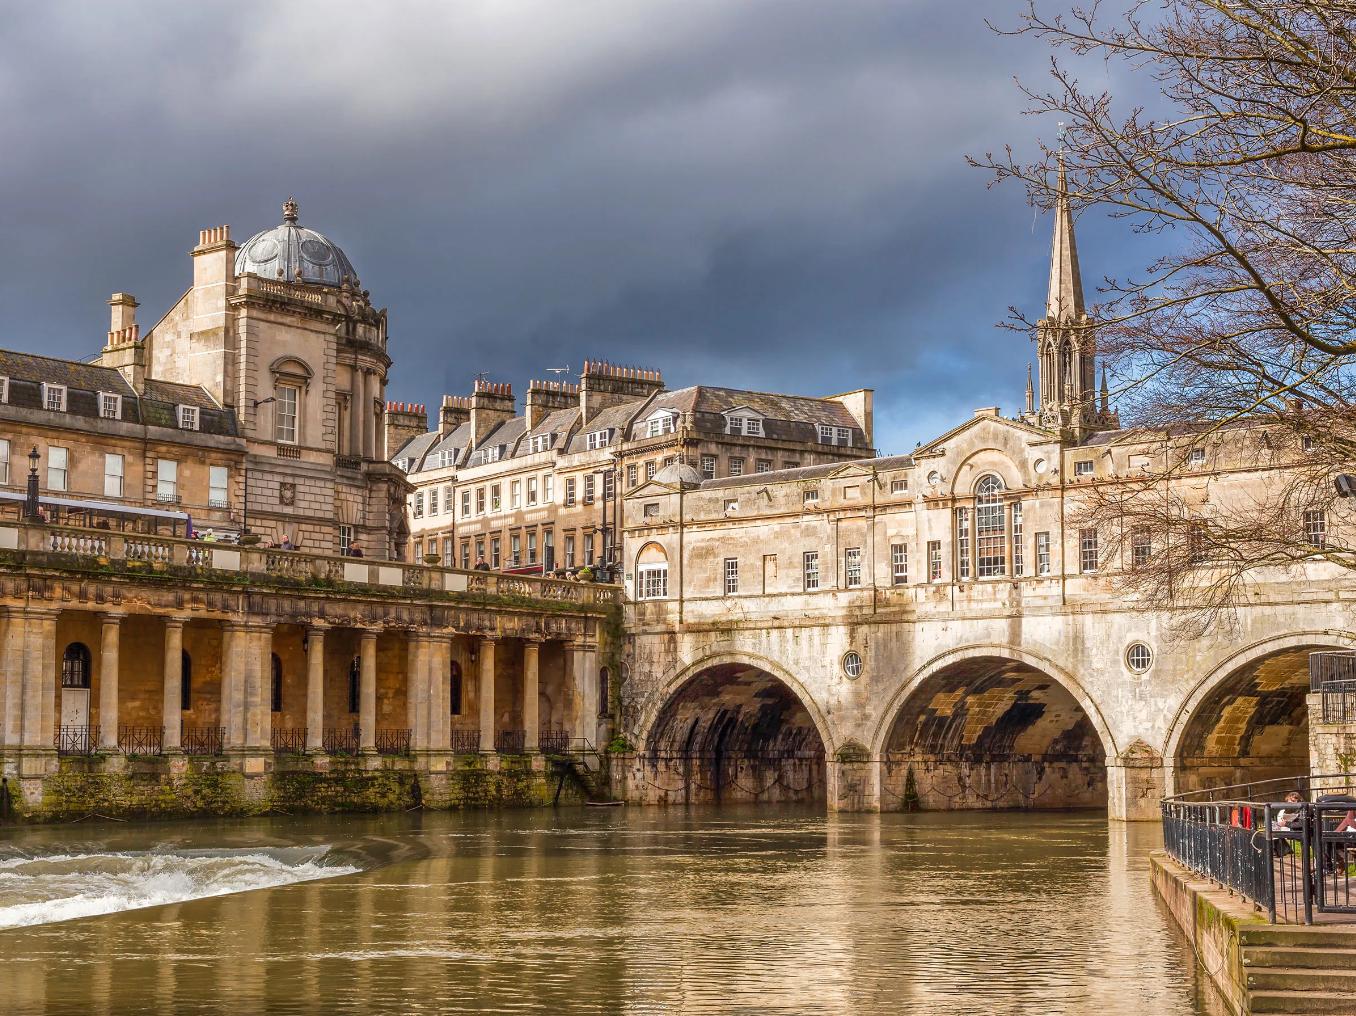
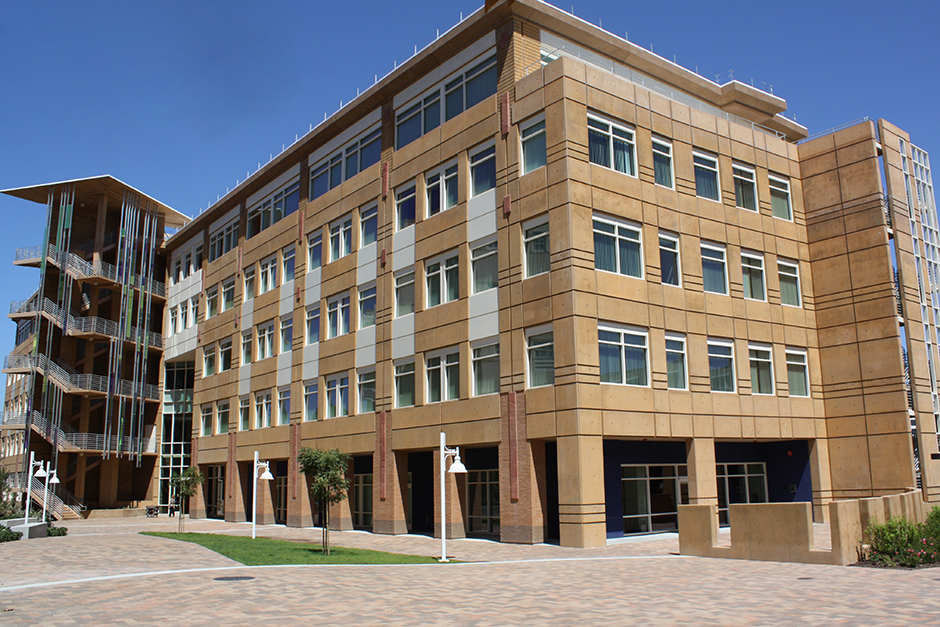
I spent a very fun year working in the Applied Digital Behavior Lab at the University of Bath while preparing my PhD applications and was fortunate to be accepted into the Cognitive Science PhD program at the University of California, Irvine, where I am currently working in Mark Steyvers’ lab.
Bath, England - Credit: Ian Woolcock — Shutterstock
I’ve always been pretty active, but when I was younger I somehow never really stuck with any particular sport for too long. To give you an idea, I’ve had a phase for: archery, badminton, CrossFit, golf, parkour, powerlifting, and skateboarding. I’m still interested in strength training, which I have been doing in some form for 10+ years, and badminton. In my dream life I’d pick CrossFit and Badminton back up again, learn Judo and do maybe just a little Olympic Lifting! Wish me luck on ever having that much free time :)
2. Technology
I like GNU/Linux, and use it as my everyday operating system. At the moment, my laptop runs NixOS with Sway. I’ve also played around with operating systems on mobile devices, currently using GrapheneOS. I enjoy coding, and wish I could do it more! My favorite languages at the moment are Julia, R, and Python. As I hope you can see, I’ve also taken an interest in some basic web development. While Quarto admittedly makes this website pretty easy to create, I also use web development skills in my research to create experiments that run in a browser. I’m super interested in picking up creative coding and I am hoping to eventually generate some art that I can post on here! :)
3. Languages
English used to be my first language as I only started learning German after relocating to the Länd at age six. Fast-forward to now, English has become my second language. Maybe because of this strange experience, I’ve had a bit of an interest in language-learning. I’ve been mostly focussing on French and was known for having a modest streak on Duolingo (2300+ days), though recently decided to start experimenting with other resources to up my game ;)
If you know a good free resource, be sure to let me know!
4. Gaming
I was quite the avid gamer as a teen, spending countless hours on the likes of Team Fortress 2, Minecraft and Guild Wars 2. While I’m much more casual these days, I’ve been picking up Guild Wars again ever since getting a Steam Deck! I also really enjoy going to board game cafés and completing escape rooms with friends.
Places I’ve been
Code
d3Highlight =require("d3@7")topoHighlight =require("topojson-client@3")// Your list of visited countriescountriesVisited = ["Germany","France","USA","Spain","Italy","Austria","Switzerland","Netherlands","Belgium","San Marino","Vatican","Malta","Monaco","United Kingdom","Hungary","Japan","Taiwan"]// Load world map data with a unique variable nameworldGeoData = {const response =awaitfetch("https://cdn.jsdelivr.net/npm/world-atlas@2/countries-110m.json");return topoHighlight.feature(await response.json(),"countries");}// Function to get current theme colorsgetThemeColors = () => {const isDark =document.body.classList.contains('quarto-dark');if (isDark) {return {visitedColor:"#00a653",notVisitedColor:"rgb(40, 40, 40)",// gray-700strokeColor:"rgb(190, 190, 190)",// gray-500strokeHoverColor:"#ffffff",tooltipBg:"rgba(40, 40, 40, 0.95)",// gray-900tooltipText:"#ffffff",legendBg:"rgba(40, 40, 40, 0.8)",// gray-900legendText:"#ffffff",controlsBg:"rgba(40, 40, 40, 0.8)",// gray-900controlsButtonBg:"rgba(150, 150, 150, 0.8)",// gray-600controlsButtonStroke:"rgb(220, 220, 220)"// gray-400 }; } else {return {visitedColor:"#00a653",notVisitedColor:"rgb(220, 220, 220)",// gray-200strokeColor:"rgb(190, 190, 190)",// gray-400strokeHoverColor:"rgb(70, 70, 70)",// gray-700tooltipBg:"rgba(255, 255, 255, 0.95)",tooltipText:"rgb(70, 70, 70)",// gray-700legendBg:"rgba(255, 255, 255, 0.9)",legendText:"rgb(70, 70, 70)",// gray-700controlsBg:"rgba(255, 255, 255, 0.9)",controlsButtonBg:"rgba(245, 245, 245, 0.8)",// gray-100controlsButtonStroke:"rgb(230, 230, 230)"// gray-300 }; }}// Map visualization with theme-adaptive colorshighlightedCountriesMap = {const colors =getThemeColors();// Set up dimensions and projectionconst mapWidth =900;const mapHeight =500;// Create a projection focused on the worldconst mapProjection = d3Highlight.geoMercator().center([10,45]).scale(150).translate([mapWidth /2, mapHeight /2]);// Create path generatorconst mapPath = d3Highlight.geoPath().projection(mapProjection);// Create SVG with transparent backgroundconst mapSvg = d3Highlight.create("svg").attr("width", mapWidth).attr("height", mapHeight).attr("viewBox", [0,0, mapWidth, mapHeight]).attr("style","max-width: 100%; height: auto; background: none;");// Create a group for all map elementsconst mapGroup = mapSvg.append("g");// Create a tooltipconst mapTooltip = d3Highlight.select(document.createElement("div")).attr("class","highlight-map-tooltip").style("position","absolute").style("background", colors.tooltipBg).style("color", colors.tooltipText).style("border-radius","5px").style("padding","8px").style("pointer-events","none").style("opacity",0).style("z-index",1000).style("font-family","sans-serif").style("font-size","14px");document.body.appendChild(mapTooltip.node());// Country name mapping for special casesconst countryNameMap = {"United States of America":"USA","United States":"USA","Holy See":"Vatican","Vatican City":"Vatican","Vatican":"Vatican","San Marino":"San Marino" };// Function to update map colors based on current themefunctionupdateMapColors() {const currentColors =getThemeColors();// Update country colors mapGroup.selectAll("path").attr("fill", d => {const countryName = d.properties.name;const normalizedName = countryNameMap[countryName] || countryName;return countriesVisited.includes(normalizedName) ? currentColors.visitedColor: currentColors.notVisitedColor; }).attr("stroke", currentColors.strokeColor);// Update tooltip colors mapTooltip.style("background", currentColors.tooltipBg).style("color", currentColors.tooltipText);// Update legend colors mapLegend.select(".legend-bg").attr("fill", currentColors.legendBg); mapLegend.selectAll(".legend-text").style("fill", currentColors.legendText);// Update control colors mapZoomControls.select(".controls-bg").attr("fill", currentColors.controlsBg); mapZoomControls.selectAll(".control-button").attr("fill", currentColors.controlsButtonBg).attr("stroke", currentColors.controlsButtonStroke); }// Draw countriesconst countries = mapGroup.selectAll("path").data(worldGeoData.features).join("path").attr("fill", d => {const countryName = d.properties.name;const normalizedName = countryNameMap[countryName] || countryName;return countriesVisited.includes(normalizedName) ? colors.visitedColor: colors.notVisitedColor; }).attr("stroke", colors.strokeColor).attr("stroke-width",0.5).attr("d", mapPath).on("mouseover",function(event, d) {const currentColors =getThemeColors(); d3Highlight.select(this).attr("stroke-width",1.5).attr("stroke", currentColors.strokeHoverColor);const countryName = d.properties.name;const normalizedName = countryNameMap[countryName] || countryName;const isVisited = countriesVisited.includes(normalizedName); mapTooltip.style("opacity",1).html(`<strong>${countryName}</strong><br/>${isVisited ?"✓ Visited":"Not visited"}`).style("left", (event.pageX+10) +"px").style("top", (event.pageY-28) +"px"); }).on("mouseout",function() {const currentColors =getThemeColors(); d3Highlight.select(this).attr("stroke-width",0.5).attr("stroke", currentColors.strokeColor); mapTooltip.style("opacity",0); }).on("mousemove",function(event) { mapTooltip.style("left", (event.pageX+10) +"px").style("top", (event.pageY-28) +"px"); });// Add a legendconst mapLegend = mapSvg.append("g").attr("transform",`translate(20, ${mapHeight -60})`);// Background for legend mapLegend.append("rect").attr("class","legend-bg").attr("x",-5).attr("y",-15).attr("width",120).attr("height",70).attr("fill", colors.legendBg).attr("rx",5).attr("ry",5);// Visited countries legend mapLegend.append("rect").attr("width",20).attr("height",20).attr("fill", colors.visitedColor); mapLegend.append("text").attr("class","legend-text").attr("x",30).attr("y",15).text("Visited").style("font-family","sans-serif").style("font-size","14px").style("fill", colors.legendText);// Not visited countries legend mapLegend.append("rect").attr("width",20).attr("height",20).attr("y",30).attr("fill", colors.notVisitedColor); mapLegend.append("text").attr("class","legend-text").attr("x",30).attr("y",45).text("Not Visited").style("font-family","sans-serif").style("font-size","14px").style("fill", colors.legendText);// Add zoom controlsconst mapZoomControls = mapSvg.append("g").attr("transform",`translate(${mapWidth -70}, 20)`);// Background for zoom controls mapZoomControls.append("rect").attr("class","controls-bg").attr("x",-5).attr("y",-5).attr("width",40).attr("height",120).attr("fill", colors.controlsBg).attr("rx",5).attr("ry",5);// Zoom in button mapZoomControls.append("rect").attr("class","control-button").attr("x",0).attr("y",0).attr("width",30).attr("height",30).attr("fill", colors.controlsButtonBg).attr("stroke", colors.controlsButtonStroke).attr("rx",5).attr("ry",5).attr("cursor","pointer").on("click", () => mapZoomBehavior.scaleBy(mapSvg.transition().duration(300),1.5)); mapZoomControls.append("text").attr("x",15).attr("y",20).attr("text-anchor","middle").attr("fill", colors.legendText).attr("font-size","18px").attr("font-weight","bold").attr("pointer-events","none").text("+");// Zoom out button mapZoomControls.append("rect").attr("class","control-button").attr("x",0).attr("y",40).attr("width",30).attr("height",30).attr("fill", colors.controlsButtonBg).attr("stroke", colors.controlsButtonStroke).attr("rx",5).attr("ry",5).attr("cursor","pointer").on("click", () => mapZoomBehavior.scaleBy(mapSvg.transition().duration(300),0.75)); mapZoomControls.append("text").attr("x",15).attr("y",60).attr("text-anchor","middle").attr("fill", colors.legendText).attr("font-size","18px").attr("font-weight","bold").attr("pointer-events","none").text("−");// Reset button mapZoomControls.append("rect").attr("class","control-button").attr("x",0).attr("y",80).attr("width",30).attr("height",30).attr("fill", colors.controlsButtonBg).attr("stroke", colors.controlsButtonStroke).attr("rx",5).attr("ry",5).attr("cursor","pointer").on("click", resetMapZoom); mapZoomControls.append("text").attr("x",15).attr("y",100).attr("text-anchor","middle").attr("fill", colors.legendText).attr("font-size","14px").attr("font-weight","bold").attr("pointer-events","none").text("R");// Define zoom behaviorconst mapZoomBehavior = d3Highlight.zoom().scaleExtent([1,8]).on("zoom", mapZoomed);functionmapZoomed(event) { mapGroup.attr("transform",event.transform);const mapStrokeScale =1/Math.sqrt(event.transform.k); mapGroup.selectAll("path").attr("stroke-width",0.5* mapStrokeScale); }functionresetMapZoom() { mapSvg.transition().duration(750).call( mapZoomBehavior.transform, d3Highlight.zoomIdentity ); }// Enable zoom and pan on the SVG mapSvg.call(mapZoomBehavior);// Listen for theme changes and update colors accordinglyconst observer =newMutationObserver(() => {updateMapColors(); }); observer.observe(document.body, {attributes:true,attributeFilter: ['class'] });return mapSvg.node();}// Display the maphighlightedCountriesMap
I have also visited a few micro-states including: Malta, Monaco, San Marino, and the Vatican.