Code
d3 = require("d3@7")
topojson = require("topojson-client@3")
// Your location data by year
locationData = [
{ year: 1998, location: "Racine", country: "USA", lat: 42.7261, lon: -87.7828 },
{ year: 1999, location: "Racine", country: "USA", lat: 42.7261, lon: -87.7828 },
{ year: 2000, location: "Racine", country: "USA", lat: 42.7261, lon: -87.7828 },
{ year: 2001, location: "Racine", country: "USA", lat: 42.7261, lon: -87.7828 },
{ year: 2002, location: "Racine", country: "USA", lat: 42.7261, lon: -87.7828 },
{ year: 2003, location: "Racine", country: "USA", lat: 42.7261, lon: -87.7828 },
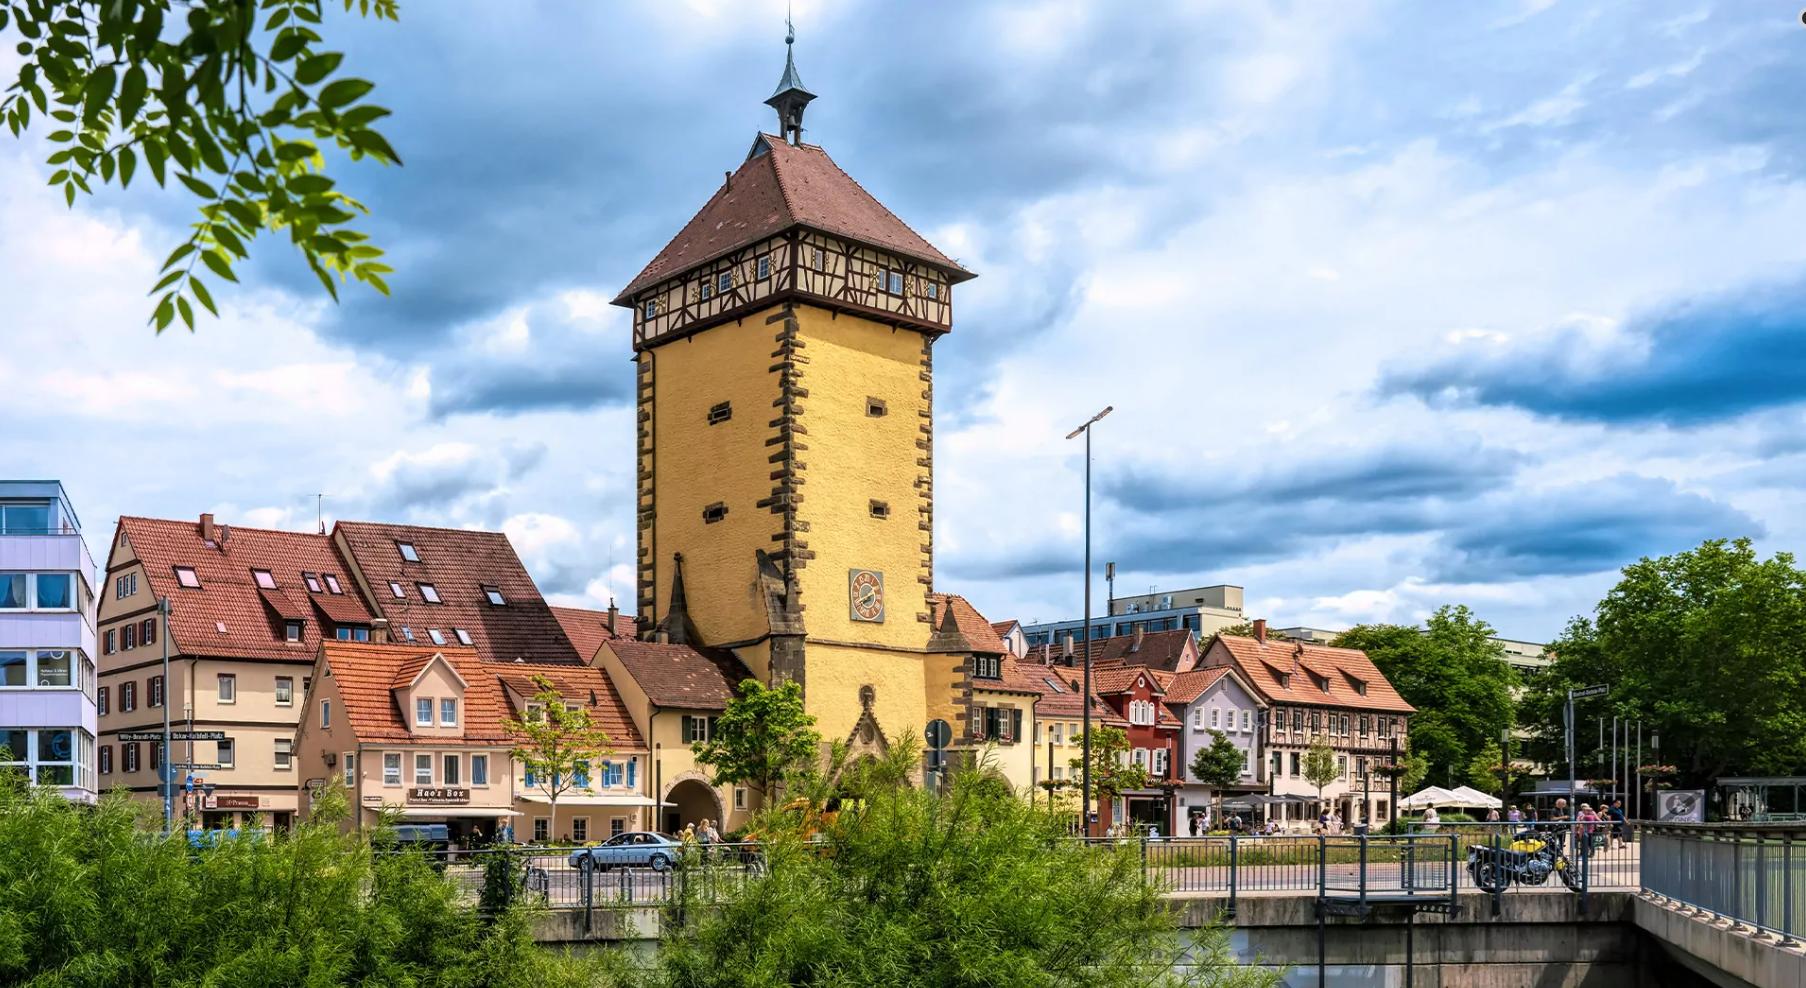
{ year: 2004, location: "Reutlingen", country: "Germany", lat: 48.4921, lon: 9.2095 },
{ year: 2005, location: "Reutlingen", country: "Germany", lat: 48.4921, lon: 9.2095 },
{ year: 2006, location: "Reutlingen", country: "Germany", lat: 48.4921, lon: 9.2095 },
{ year: 2007, location: "Reutlingen", country: "Germany", lat: 48.4921, lon: 9.2095 },
{ year: 2008, location: "Reutlingen", country: "Germany", lat: 48.4921, lon: 9.2095 },
{ year: 2009, location: "Reutlingen", country: "Germany", lat: 48.4921, lon: 9.2095 },
{ year: 2010, location: "Reutlingen", country: "Germany", lat: 48.4921, lon: 9.2095 },
{ year: 2011, location: "Reutlingen", country: "Germany", lat: 48.4921, lon: 9.2095 },
{ year: 2012, location: "Reutlingen", country: "Germany", lat: 48.4921, lon: 9.2095 },
{ year: 2013, location: "Reutlingen", country: "Germany", lat: 48.4921, lon: 9.2095 },
{ year: 2014, location: "Reutlingen", country: "Germany", lat: 48.4921, lon: 9.2095 },
{ year: 2015, location: "Reutlingen", country: "Germany", lat: 48.4921, lon: 9.2095 },
{ year: 2016, location: "Reutlingen", country: "Germany", lat: 48.4921, lon: 9.2095 },
{ year: 2017, location: "Reutlingen", country: "Germany", lat: 48.4921, lon: 9.2095 },
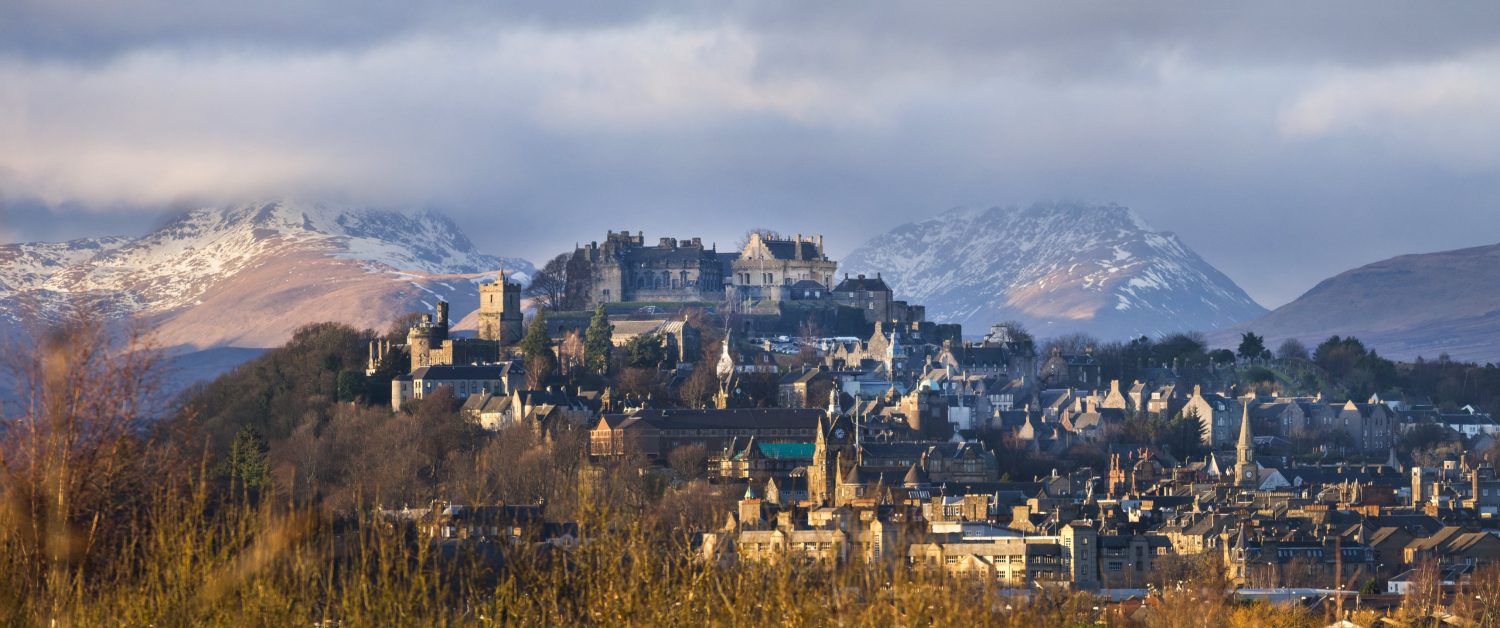
{ year: 2018, location: "Stirling", country: "Scotland", lat: 56.1165, lon: -3.9369 },
{ year: 2019, location: "Stirling", country: "Scotland", lat: 56.1165, lon: -3.9369 },
{ year: 2020, location: "Stirling", country: "Scotland", lat: 56.1165, lon: -3.9369 },
{ year: 2021, location: "Stirling", country: "Scotland", lat: 56.1165, lon: -3.9369 },
{ year: 2022, location: "Royal Leamington Spa", country: "England", lat: 52.2851, lon: -1.5364 },
{ year: 2023, location: "Bath", country: "England", lat: 51.3751, lon: -2.3618 },
{ year: 2024, location: "Irvine", country: "USA", lat: 33.6846, lon: -117.8265 },
{ year: 2025, location: "Irvine", country: "USA", lat: 33.6846, lon: -117.8265 }
]
// Load world map data
world = {
const response = await fetch("https://cdn.jsdelivr.net/npm/world-atlas@2/countries-110m.json");
return topojson.feature(await response.json(), "countries");
}
// Simple year selector with buttons
viewof selectedYear = {
const MIN_YEAR = 1998;
const MAX_YEAR = 2025;
const DEFAULT_YEAR = 1998;
const container = html`<div style="display: flex; flex-direction: column; width: 100%;">
<div style="display: flex; align-items: center; margin-bottom: 8px;">
<button id="prev-year" style="
background: rgba(60, 60, 60, 0.7);
color: #e0e0e0;
border: none;
border-radius: 4px;
padding: 4px 8px;
margin-right: 10px;
cursor: pointer;
font-size: 16px;
width: 36px;
">◀</button>
<div style="flex-grow: 1; text-align: center; color: #e0e0e0; font-size: 16px;">
Year: <span id="year-display">${DEFAULT_YEAR}</span>
</div>
<button id="next-year" style="
background: rgba(60, 60, 60, 0.7);
color: #e0e0e0;
border: none;
border-radius: 4px;
padding: 4px 8px;
margin-left: 10px;
cursor: pointer;
font-size: 16px;
width: 36px;
">▶</button>
</div>
<input type="range" id="year-slider" min="${MIN_YEAR}" max="${MAX_YEAR}" step="1" value="${DEFAULT_YEAR}" style="width: 100%; accent-color: #4CAF50;">
</div>`;
const slider = container.querySelector("#year-slider");
const display = container.querySelector("#year-display");
const prevBtn = container.querySelector("#prev-year");
const nextBtn = container.querySelector("#next-year");
let value = DEFAULT_YEAR;
// Function to update everything
const updateYear = (year) => {
year = Math.max(MIN_YEAR, Math.min(MAX_YEAR, year));
value = year;
slider.value = year;
display.textContent = year;
// Update button states
prevBtn.disabled = year <= MIN_YEAR;
prevBtn.style.opacity = year <= MIN_YEAR ? "0.5" : "1";
nextBtn.disabled = year >= MAX_YEAR;
nextBtn.style.opacity = year >= MAX_YEAR ? "0.5" : "1";
container.dispatchEvent(new CustomEvent("input"));
};
// Update when slider changes
slider.oninput = () => {
updateYear(parseInt(slider.value));
};
// Previous year button
prevBtn.onclick = () => {
updateYear(value - 1);
};
// Next year button
nextBtn.onclick = () => {
updateYear(value + 1);
};
// Add keyboard navigation
container.tabIndex = 0;
container.style.outline = "none";
container.addEventListener("keydown", (event) => {
if (event.key === "ArrowLeft") {
event.preventDefault();
updateYear(value - 1);
} else if (event.key === "ArrowRight") {
event.preventDefault();
updateYear(value + 1);
}
});
// Initialize
updateYear(DEFAULT_YEAR);
// Define getter for Observable
Object.defineProperty(container, "value", {
get: () => value
});
return container;
}
// Current location based on selected year
currentLocation = locationData.find(d => d.year === selectedYear)
// Create a tooltip element that will be reused
tooltip = {
const div = html`<div style="
position: absolute;
background: rgba(40, 40, 40, 0.9);
border: 1px solid #555;
border-radius: 5px;
padding: 10px;
pointer-events: none;
opacity: 0;
transition: opacity 0.2s;
z-index: 1000;
font-family: sans-serif;
font-size: 14px;
max-width: 200px;
color: #e0e0e0;
box-shadow: 0 2px 5px rgba(0, 0, 0, 0.5);
"></div>`;
document.body.appendChild(div);
return div;
}
// Map visualization with tooltips integrated directly and interactive pan/zoom
mapVisualization = {
// Set up dimensions and projection
const width = 900;
const height = 500;
// Create a projection focused on US and Europe
const projection = d3.geoMercator()
.center([-20, 45])
.scale(350)
.translate([width / 2, height / 2]);
// Create path generator
const path = d3.geoPath().projection(projection);
// Create SVG
const svg = d3.create("svg")
.attr("width", width)
.attr("height", height)
.attr("viewBox", [0, 0, width, height])
.attr("style", "max-width: 100%; height: auto;");
// Add ocean background
svg.append("rect")
.attr("width", width)
.attr("height", height)
.attr("fill", "none");
// Create a group for all map elements that will be transformed during zoom/pan
const g = svg.append("g");
// Draw countries
g.append("g")
.selectAll("path")
.data(world.features)
.join("path")
.attr("fill", "#555555") // Dark gray for land
.attr("stroke", "#444") // Darker border for countries
.attr("stroke-width", 0.5)
.attr("d", path);
// Get unique locations to avoid drawing the same point multiple times
const uniqueLocations = Array.from(
new Map(locationData.map(d => [`${d.lat},${d.lon}`, d])).values()
).sort((a, b) => a.year - b.year);
// Draw path lines connecting unique locations
const lineGenerator = d3.line()
.x(d => projection([d.lon, d.lat])[0])
.y(d => projection([d.lon, d.lat])[1])
.curve(d3.curveCardinal.tension(0.5)); // Reduce tension to prevent overshooting
// Draw the complete path
g.append("path")
.attr("d", lineGenerator(uniqueLocations))
.attr("fill", "none")
.attr("stroke", "#6ab7ff") // Lighter blue for better visibility
.attr("stroke-width", 2)
.attr("stroke-dasharray", "5,5")
.attr("opacity", 0.7);
// Highlight the path traveled up to the current year
// Find the index of the last location that should be included in the path for the selected year
const currentYearIndex = uniqueLocations.findIndex(d => {
const locationsAtThisPoint = locationData.filter(loc =>
loc.lat === d.lat && loc.lon === d.lon
);
const years = locationsAtThisPoint.map(loc => loc.year);
const minYear = Math.min(...years);
// Check if this is the first location where selectedYear is less than minYear
return selectedYear < minYear;
});
// Determine how much of the path to draw
let traveledPathIndex;
if (currentYearIndex === -1) {
// If no location is found (we're at or beyond the last year), include all locations
traveledPathIndex = uniqueLocations.length;
} else if (currentYearIndex === 0) {
// If even the first location is in the future, don't draw any path
traveledPathIndex = 0;
} else {
// Otherwise, include all locations up to but not including the future location
traveledPathIndex = currentYearIndex;
}
// Only draw the path if there are locations to include
if (traveledPathIndex > 0) {
const traveledPath = uniqueLocations.slice(0, traveledPathIndex);
g.append("path")
.attr("d", lineGenerator(traveledPath))
.attr("fill", "none")
.attr("stroke", "#ff7675") // Softer red for dark mode
.attr("stroke-width", 3)
.attr("opacity", 0.9);
}
// Create a group for markers and labels
const markersGroup = g.append("g");
// Get unique locations for markers
const markerLocations = Array.from(
new Map(locationData.map(d => [`${d.lat},${d.lon}`, d])).values()
);
// Draw all locations as small markers with integrated tooltips
markersGroup.selectAll("circle")
.data(markerLocations)
.join("circle")
.attr("cx", d => projection([d.lon, d.lat])[0])
.attr("cy", d => projection([d.lon, d.lat])[1])
.attr("r", d => {
// Check if this location includes the selected year
const isCurrentLocation = locationData.some(loc =>
loc.year === selectedYear &&
loc.lat === d.lat &&
loc.lon === d.lon
);
return isCurrentLocation ? 8 : 4;
})
.attr("fill", d => {
// Check if this location includes the selected year
const isCurrentLocation = locationData.some(loc =>
loc.year === selectedYear &&
loc.lat === d.lat &&
loc.lon === d.lon
);
return isCurrentLocation ? "#ff7675" : "#6ab7ff";
})
.attr("stroke", "#ddd") // Light border for contrast
.attr("stroke-width", d => {
const isCurrentLocation = locationData.some(loc =>
loc.year === selectedYear &&
loc.lat === d.lat &&
loc.lon === d.lon
);
return isCurrentLocation ? 2 : 1;
})
.attr("opacity", d => {
const isCurrentLocation = locationData.some(loc =>
loc.year === selectedYear &&
loc.lat === d.lat &&
loc.lon === d.lon
);
return isCurrentLocation ? 1 : 0.7;
})
.on("mouseover", function(event, d) {
// Find all years at this location
const locYears = locationData
.filter(loc => loc.lat === d.lat && loc.lon === d.lon)
.map(loc => loc.year);
// Create year ranges for display
const yearRanges = [];
let start = locYears[0];
let end = locYears[0];
for (let i = 1; i < locYears.length; i++) {
if (locYears[i] === end + 1) {
end = locYears[i];
} else {
yearRanges.push(start === end ? `${start}` : `${start}-${end}`);
start = end = locYears[i];
}
}
yearRanges.push(start === end ? `${start}` : `${start}-${end}`);
d3.select(this)
.attr("r", 12)
.attr("stroke-width", 3);
tooltip.innerHTML = `
<strong style="color: #ff9f43;">${d.location}, ${d.country}</strong>
Years: ${yearRanges.join(", ")}
Coordinates: ${d.lat.toFixed(2)}, ${d.lon.toFixed(2)}
`;
tooltip.style.opacity = "1";
tooltip.style.left = (event.pageX + 15) + "px";
tooltip.style.top = (event.pageY - 28) + "px";
})
.on("mouseout", function(event, d) {
const isCurrentLocation = locationData.some(loc =>
loc.year === selectedYear &&
loc.lat === d.lat &&
loc.lon === d.lon
);
d3.select(this)
.attr("r", isCurrentLocation ? 8 : 4)
.attr("stroke-width", isCurrentLocation ? 2 : 1);
tooltip.style.opacity = "0";
})
.on("mousemove", function(event) {
tooltip.style.left = (event.pageX + 15) + "px";
tooltip.style.top = (event.pageY - 28) + "px";
});
// Add label for current location
if (currentLocation) {
const [x, y] = projection([currentLocation.lon, currentLocation.lat]);
// Add a background for the text to improve readability
markersGroup.append("rect")
.attr("x", x + 10)
.attr("y", y - 15)
.attr("width", `${currentLocation.location.length * 8 + 30}px`)
.attr("height", "22px")
.attr("fill", "rgba(40, 40, 40, 0.7)")
.attr("rx", 3)
.attr("ry", 3);
markersGroup.append("text")
.attr("x", x + 12)
.attr("y", y)
.text(`${currentLocation.location} (${currentLocation.year})`)
.attr("font-family", "sans-serif")
.attr("font-size", "14px")
.attr("font-weight", "bold")
.attr("fill", "#e0e0e0"); // Light text for dark mode
}
// Add zoom controls
const zoomControls = svg.append("g")
.attr("transform", `translate(${width - 70}, 20)`);
// Zoom in button
zoomControls.append("rect")
.attr("x", 0)
.attr("y", 0)
.attr("width", 30)
.attr("height", 30)
.attr("fill", "rgba(60, 60, 60, 0.7)")
.attr("rx", 5)
.attr("ry", 5)
.attr("cursor", "pointer")
.on("click", () => zoom.scaleBy(svg.transition().duration(300), 1.5));
zoomControls.append("text")
.attr("x", 15)
.attr("y", 20)
.attr("text-anchor", "middle")
.attr("fill", "#e0e0e0")
.attr("font-size", "18px")
.attr("font-weight", "bold")
.attr("pointer-events", "none")
.text("+");
// Zoom out button
zoomControls.append("rect")
.attr("x", 0)
.attr("y", 40)
.attr("width", 30)
.attr("height", 30)
.attr("fill", "rgba(60, 60, 60, 0.7)")
.attr("rx", 5)
.attr("ry", 5)
.attr("cursor", "pointer")
.on("click", () => zoom.scaleBy(svg.transition().duration(300), 0.75));
zoomControls.append("text")
.attr("x", 15)
.attr("y", 60)
.attr("text-anchor", "middle")
.attr("fill", "#e0e0e0")
.attr("font-size", "18px")
.attr("font-weight", "bold")
.attr("pointer-events", "none")
.text("−");
// Reset button
zoomControls.append("rect")
.attr("x", 0)
.attr("y", 80)
.attr("width", 30)
.attr("height", 30)
.attr("fill", "rgba(60, 60, 60, 0.7)")
.attr("rx", 5)
.attr("ry", 5)
.attr("cursor", "pointer")
.on("click", resetZoom);
zoomControls.append("text")
.attr("x", 15)
.attr("y", 100)
.attr("text-anchor", "middle")
.attr("fill", "#e0e0e0")
.attr("font-size", "14px")
.attr("font-weight", "bold")
.attr("pointer-events", "none")
.text("R");
// Define zoom behavior
const zoom = d3.zoom()
.scaleExtent([0.5, 8])
.on("zoom", zoomed);
function zoomed(event) {
g.attr("transform", event.transform);
// Adjust stroke widths based on zoom level to keep them visually consistent
const strokeScale = 1 / Math.sqrt(event.transform.k);
g.selectAll("path").attr("stroke-width", 0.5 * strokeScale);
// Update marker sizes based on zoom level
markersGroup.selectAll("circle").each(function(d) {
const isCurrentLocation = locationData.some(loc =>
loc.year === selectedYear &&
loc.lat === d.lat &&
loc.lon === d.lon
);
d3.select(this)
.attr("r", (isCurrentLocation ? 8 : 4) * strokeScale)
.attr("stroke-width", (isCurrentLocation ? 2 : 1) * strokeScale);
});
}
function resetZoom() {
svg.transition().duration(750).call(
zoom.transform,
d3.zoomIdentity
);
}
// Enable zoom and pan on the SVG
svg.call(zoom);
return svg.node();
}
// Display the map
mapVisualization;locationData = Array(28) [Object, Object, Object, Object, Object, Object, Object, Object, Object, Object, Object, Object, Object, Object, Object, Object, Object, Object, Object, Object, …]
Year: 1998
selectedYear = 1998
currentLocation = Object {year: 1998, location: "Racine", country: "USA", lat: 42.7261, lon: -87.7828}
tooltip = HTMLDivElement {}