d3 =require("d3@7")topojson =require("topojson-client@3")// Your location data by yearlocationData = [ { year:1998,location:"Racine",country:"USA",lat:42.7261,lon:-87.7828 }, { year:1999,location:"Racine",country:"USA",lat:42.7261,lon:-87.7828 }, { year:2000,location:"Racine",country:"USA",lat:42.7261,lon:-87.7828 }, { year:2001,location:"Racine",country:"USA",lat:42.7261,lon:-87.7828 }, { year:2002,location:"Racine",country:"USA",lat:42.7261,lon:-87.7828 }, { year:2003,location:"Racine",country:"USA",lat:42.7261,lon:-87.7828 }, { year:2004,location:"Reutlingen",country:"Germany",lat:48.4921,lon:9.2095 }, { year:2005,location:"Reutlingen",country:"Germany",lat:48.4921,lon:9.2095 }, { year:2006,location:"Reutlingen",country:"Germany",lat:48.4921,lon:9.2095 }, { year:2007,location:"Reutlingen",country:"Germany",lat:48.4921,lon:9.2095 }, { year:2008,location:"Reutlingen",country:"Germany",lat:48.4921,lon:9.2095 }, { year:2009,location:"Reutlingen",country:"Germany",lat:48.4921,lon:9.2095 }, { year:2010,location:"Reutlingen",country:"Germany",lat:48.4921,lon:9.2095 }, { year:2011,location:"Reutlingen",country:"Germany",lat:48.4921,lon:9.2095 }, { year:2012,location:"Reutlingen",country:"Germany",lat:48.4921,lon:9.2095 }, { year:2013,location:"Reutlingen",country:"Germany",lat:48.4921,lon:9.2095 }, { year:2014,location:"Reutlingen",country:"Germany",lat:48.4921,lon:9.2095 }, { year:2015,location:"Reutlingen",country:"Germany",lat:48.4921,lon:9.2095 }, { year:2016,location:"Reutlingen",country:"Germany",lat:48.4921,lon:9.2095 }, { year:2017,location:"Reutlingen",country:"Germany",lat:48.4921,lon:9.2095 }, { year:2018,location:"Stirling",country:"Scotland",lat:56.1165,lon:-3.9369 }, { year:2019,location:"Stirling",country:"Scotland",lat:56.1165,lon:-3.9369 }, { year:2020,location:"Stirling",country:"Scotland",lat:56.1165,lon:-3.9369 }, { year:2021,location:"Stirling",country:"Scotland",lat:56.1165,lon:-3.9369 }, { year:2022,location:"Royal Leamington Spa",country:"England",lat:52.2851,lon:-1.5364 }, { year:2023,location:"Bath",country:"England",lat:51.3751,lon:-2.3618 }, { year:2024,location:"Irvine",country:"USA",lat:33.6846,lon:-117.8265 }, { year:2025,location:"Irvine",country:"USA",lat:33.6846,lon:-117.8265 }]// Load world map dataworld = {const response =awaitfetch("https://cdn.jsdelivr.net/npm/world-atlas@2/countries-110m.json");return topojson.feature(await response.json(),"countries");}// Simple year selector with buttonsviewof selectedYear = {const MIN_YEAR =1998;const MAX_YEAR =2025;const DEFAULT_YEAR =1998;const container =html`<div style="display: flex; flex-direction: column; width: 100%;"> <div style="display: flex; align-items: center; margin-bottom: 8px;"> <button id="prev-year" style=" background: rgba(60, 60, 60, 0.7); color: #e0e0e0; border: none; border-radius: 4px; padding: 4px 8px; margin-right: 10px; cursor: pointer; font-size: 16px; width: 36px; ">◀</button> <div style="flex-grow: 1; text-align: center; color: #e0e0e0; font-size: 16px;"> Year: <span id="year-display">${DEFAULT_YEAR}</span> </div> <button id="next-year" style=" background: rgba(60, 60, 60, 0.7); color: #e0e0e0; border: none; border-radius: 4px; padding: 4px 8px; margin-left: 10px; cursor: pointer; font-size: 16px; width: 36px; ">▶</button> </div> <input type="range" id="year-slider" min="${MIN_YEAR}" max="${MAX_YEAR}" step="1" value="${DEFAULT_YEAR}" style="width: 100%; accent-color: #4CAF50;"> </div>`;const slider = container.querySelector("#year-slider");const display = container.querySelector("#year-display");const prevBtn = container.querySelector("#prev-year");const nextBtn = container.querySelector("#next-year");let value = DEFAULT_YEAR;// Function to update everythingconst updateYear = (year) => { year =Math.max(MIN_YEAR,Math.min(MAX_YEAR, year)); value = year; slider.value= year; display.textContent= year;// Update button states prevBtn.disabled= year <= MIN_YEAR; prevBtn.style.opacity= year <= MIN_YEAR ?"0.5":"1"; nextBtn.disabled= year >= MAX_YEAR; nextBtn.style.opacity= year >= MAX_YEAR ?"0.5":"1"; container.dispatchEvent(newCustomEvent("input")); };// Update when slider changes slider.oninput= () => {updateYear(parseInt(slider.value)); };// Previous year button prevBtn.onclick= () => {updateYear(value -1); };// Next year button nextBtn.onclick= () => {updateYear(value +1); };// Add keyboard navigation container.tabIndex=0; container.style.outline="none"; container.addEventListener("keydown", (event) => {if (event.key==="ArrowLeft") {event.preventDefault();updateYear(value -1); } elseif (event.key==="ArrowRight") {event.preventDefault();updateYear(value +1); } });// InitializeupdateYear(DEFAULT_YEAR);// Define getter for ObservableObject.defineProperty(container,"value", {get: () => value });return container;}// Current location based on selected yearcurrentLocation = locationData.find(d => d.year=== selectedYear)// Create a tooltip element that will be reusedtooltip = {const div =html`<div style=" position: absolute; background: rgba(40, 40, 40, 0.9); border: 1px solid #555; border-radius: 5px; padding: 10px; pointer-events: none; opacity: 0; transition: opacity 0.2s; z-index: 1000; font-family: sans-serif; font-size: 14px; max-width: 200px; color: #e0e0e0; box-shadow: 0 2px 5px rgba(0, 0, 0, 0.5); "></div>`;document.body.appendChild(div);return div;}// Map visualization with tooltips integrated directly and interactive pan/zoommapVisualization = {// Set up dimensions and projectionconst width =900;const height =500;// Create a projection focused on US and Europeconst projection = d3.geoMercator().center([-20,45]).scale(350).translate([width /2, height /2]);// Create path generatorconst path = d3.geoPath().projection(projection);// Create SVGconst svg = d3.create("svg").attr("width", width).attr("height", height).attr("viewBox", [0,0, width, height]).attr("style","max-width: 100%; height: auto;");// Add ocean background svg.append("rect").attr("width", width).attr("height", height).attr("fill","none");// Create a group for all map elements that will be transformed during zoom/panconst g = svg.append("g");// Draw countries g.append("g").selectAll("path").data(world.features).join("path").attr("fill","#555555") // Dark gray for land.attr("stroke","#444") // Darker border for countries.attr("stroke-width",0.5).attr("d", path);// Get unique locations to avoid drawing the same point multiple timesconst uniqueLocations =Array.from(newMap(locationData.map(d => [`${d.lat},${d.lon}`, d])).values() ).sort((a, b) => a.year- b.year);// Draw path lines connecting unique locationsconst lineGenerator = d3.line().x(d =>projection([d.lon, d.lat])[0]).y(d =>projection([d.lon, d.lat])[1]).curve(d3.curveCardinal.tension(0.5));// Reduce tension to prevent overshooting// Draw the complete path g.append("path").attr("d",lineGenerator(uniqueLocations)).attr("fill","none").attr("stroke","#6ab7ff") // Lighter blue for better visibility.attr("stroke-width",2).attr("stroke-dasharray","5,5").attr("opacity",0.7);// Highlight the path traveled up to the current year// Find the index of the last location that should be included in the path for the selected yearconst currentYearIndex = uniqueLocations.findIndex(d => {const locationsAtThisPoint = locationData.filter(loc => loc.lat=== d.lat&& loc.lon=== d.lon );const years = locationsAtThisPoint.map(loc => loc.year);const minYear =Math.min(...years);// Check if this is the first location where selectedYear is less than minYearreturn selectedYear < minYear; });// Determine how much of the path to drawlet traveledPathIndex;if (currentYearIndex ===-1) {// If no location is found (we're at or beyond the last year), include all locations traveledPathIndex = uniqueLocations.length; } elseif (currentYearIndex ===0) {// If even the first location is in the future, don't draw any path traveledPathIndex =0; } else {// Otherwise, include all locations up to but not including the future location traveledPathIndex = currentYearIndex; }// Only draw the path if there are locations to includeif (traveledPathIndex >0) {const traveledPath = uniqueLocations.slice(0, traveledPathIndex); g.append("path").attr("d",lineGenerator(traveledPath)).attr("fill","none").attr("stroke","#ff7675") // Softer red for dark mode.attr("stroke-width",3).attr("opacity",0.9); }// Create a group for markers and labelsconst markersGroup = g.append("g");// Get unique locations for markersconst markerLocations =Array.from(newMap(locationData.map(d => [`${d.lat},${d.lon}`, d])).values() );// Draw all locations as small markers with integrated tooltips markersGroup.selectAll("circle").data(markerLocations).join("circle").attr("cx", d =>projection([d.lon, d.lat])[0]).attr("cy", d =>projection([d.lon, d.lat])[1]).attr("r", d => {// Check if this location includes the selected yearconst isCurrentLocation = locationData.some(loc => loc.year=== selectedYear && loc.lat=== d.lat&& loc.lon=== d.lon );return isCurrentLocation ?8:4; }).attr("fill", d => {// Check if this location includes the selected yearconst isCurrentLocation = locationData.some(loc => loc.year=== selectedYear && loc.lat=== d.lat&& loc.lon=== d.lon );return isCurrentLocation ?"#ff7675":"#6ab7ff"; }).attr("stroke","#ddd") // Light border for contrast.attr("stroke-width", d => {const isCurrentLocation = locationData.some(loc => loc.year=== selectedYear && loc.lat=== d.lat&& loc.lon=== d.lon );return isCurrentLocation ?2:1; }).attr("opacity", d => {const isCurrentLocation = locationData.some(loc => loc.year=== selectedYear && loc.lat=== d.lat&& loc.lon=== d.lon );return isCurrentLocation ?1:0.7; }).on("mouseover",function(event, d) {// Find all years at this locationconst locYears = locationData.filter(loc => loc.lat=== d.lat&& loc.lon=== d.lon).map(loc => loc.year);// Create year ranges for displayconst yearRanges = [];let start = locYears[0];let end = locYears[0];for (let i =1; i < locYears.length; i++) {if (locYears[i] === end +1) { end = locYears[i]; } else { yearRanges.push(start === end ?`${start}`:`${start}-${end}`); start = end = locYears[i]; } } yearRanges.push(start === end ?`${start}`:`${start}-${end}`); d3.select(this).attr("r",12).attr("stroke-width",3); tooltip.innerHTML=` <strong style="color: #ff9f43;">${d.location}, ${d.country}</strong> Years: ${yearRanges.join(", ")} Coordinates: ${d.lat.toFixed(2)}, ${d.lon.toFixed(2)} `; tooltip.style.opacity="1"; tooltip.style.left= (event.pageX+15) +"px"; tooltip.style.top= (event.pageY-28) +"px"; }).on("mouseout",function(event, d) {const isCurrentLocation = locationData.some(loc => loc.year=== selectedYear && loc.lat=== d.lat&& loc.lon=== d.lon ); d3.select(this).attr("r", isCurrentLocation ?8:4).attr("stroke-width", isCurrentLocation ?2:1); tooltip.style.opacity="0"; }).on("mousemove",function(event) { tooltip.style.left= (event.pageX+15) +"px"; tooltip.style.top= (event.pageY-28) +"px"; });// Add label for current locationif (currentLocation) {const [x, y] =projection([currentLocation.lon, currentLocation.lat]);// Add a background for the text to improve readability markersGroup.append("rect").attr("x", x +10).attr("y", y -15).attr("width",`${currentLocation.location.length*8+30}px`).attr("height","22px").attr("fill","rgba(40, 40, 40, 0.7)").attr("rx",3).attr("ry",3); markersGroup.append("text").attr("x", x +12).attr("y", y).text(`${currentLocation.location} (${currentLocation.year})`).attr("font-family","sans-serif").attr("font-size","14px").attr("font-weight","bold").attr("fill","#e0e0e0");// Light text for dark mode }// Add zoom controlsconst zoomControls = svg.append("g").attr("transform",`translate(${width -70}, 20)`);// Zoom in button zoomControls.append("rect").attr("x",0).attr("y",0).attr("width",30).attr("height",30).attr("fill","rgba(60, 60, 60, 0.7)").attr("rx",5).attr("ry",5).attr("cursor","pointer").on("click", () => zoom.scaleBy(svg.transition().duration(300),1.5)); zoomControls.append("text").attr("x",15).attr("y",20).attr("text-anchor","middle").attr("fill","#e0e0e0").attr("font-size","18px").attr("font-weight","bold").attr("pointer-events","none").text("+");// Zoom out button zoomControls.append("rect").attr("x",0).attr("y",40).attr("width",30).attr("height",30).attr("fill","rgba(60, 60, 60, 0.7)").attr("rx",5).attr("ry",5).attr("cursor","pointer").on("click", () => zoom.scaleBy(svg.transition().duration(300),0.75)); zoomControls.append("text").attr("x",15).attr("y",60).attr("text-anchor","middle").attr("fill","#e0e0e0").attr("font-size","18px").attr("font-weight","bold").attr("pointer-events","none").text("−");// Reset button zoomControls.append("rect").attr("x",0).attr("y",80).attr("width",30).attr("height",30).attr("fill","rgba(60, 60, 60, 0.7)").attr("rx",5).attr("ry",5).attr("cursor","pointer").on("click", resetZoom); zoomControls.append("text").attr("x",15).attr("y",100).attr("text-anchor","middle").attr("fill","#e0e0e0").attr("font-size","14px").attr("font-weight","bold").attr("pointer-events","none").text("R");// Define zoom behaviorconst zoom = d3.zoom().scaleExtent([0.5,8]).on("zoom", zoomed);functionzoomed(event) { g.attr("transform",event.transform);// Adjust stroke widths based on zoom level to keep them visually consistentconst strokeScale =1/Math.sqrt(event.transform.k); g.selectAll("path").attr("stroke-width",0.5* strokeScale);// Update marker sizes based on zoom level markersGroup.selectAll("circle").each(function(d) {const isCurrentLocation = locationData.some(loc => loc.year=== selectedYear && loc.lat=== d.lat&& loc.lon=== d.lon ); d3.select(this).attr("r", (isCurrentLocation ?8:4) * strokeScale).attr("stroke-width", (isCurrentLocation ?2:1) * strokeScale); }); }functionresetZoom() { svg.transition().duration(750).call( zoom.transform, d3.zoomIdentity ); }// Enable zoom and pan on the SVG svg.call(zoom);return svg.node();}// Display the mapmapVisualization;
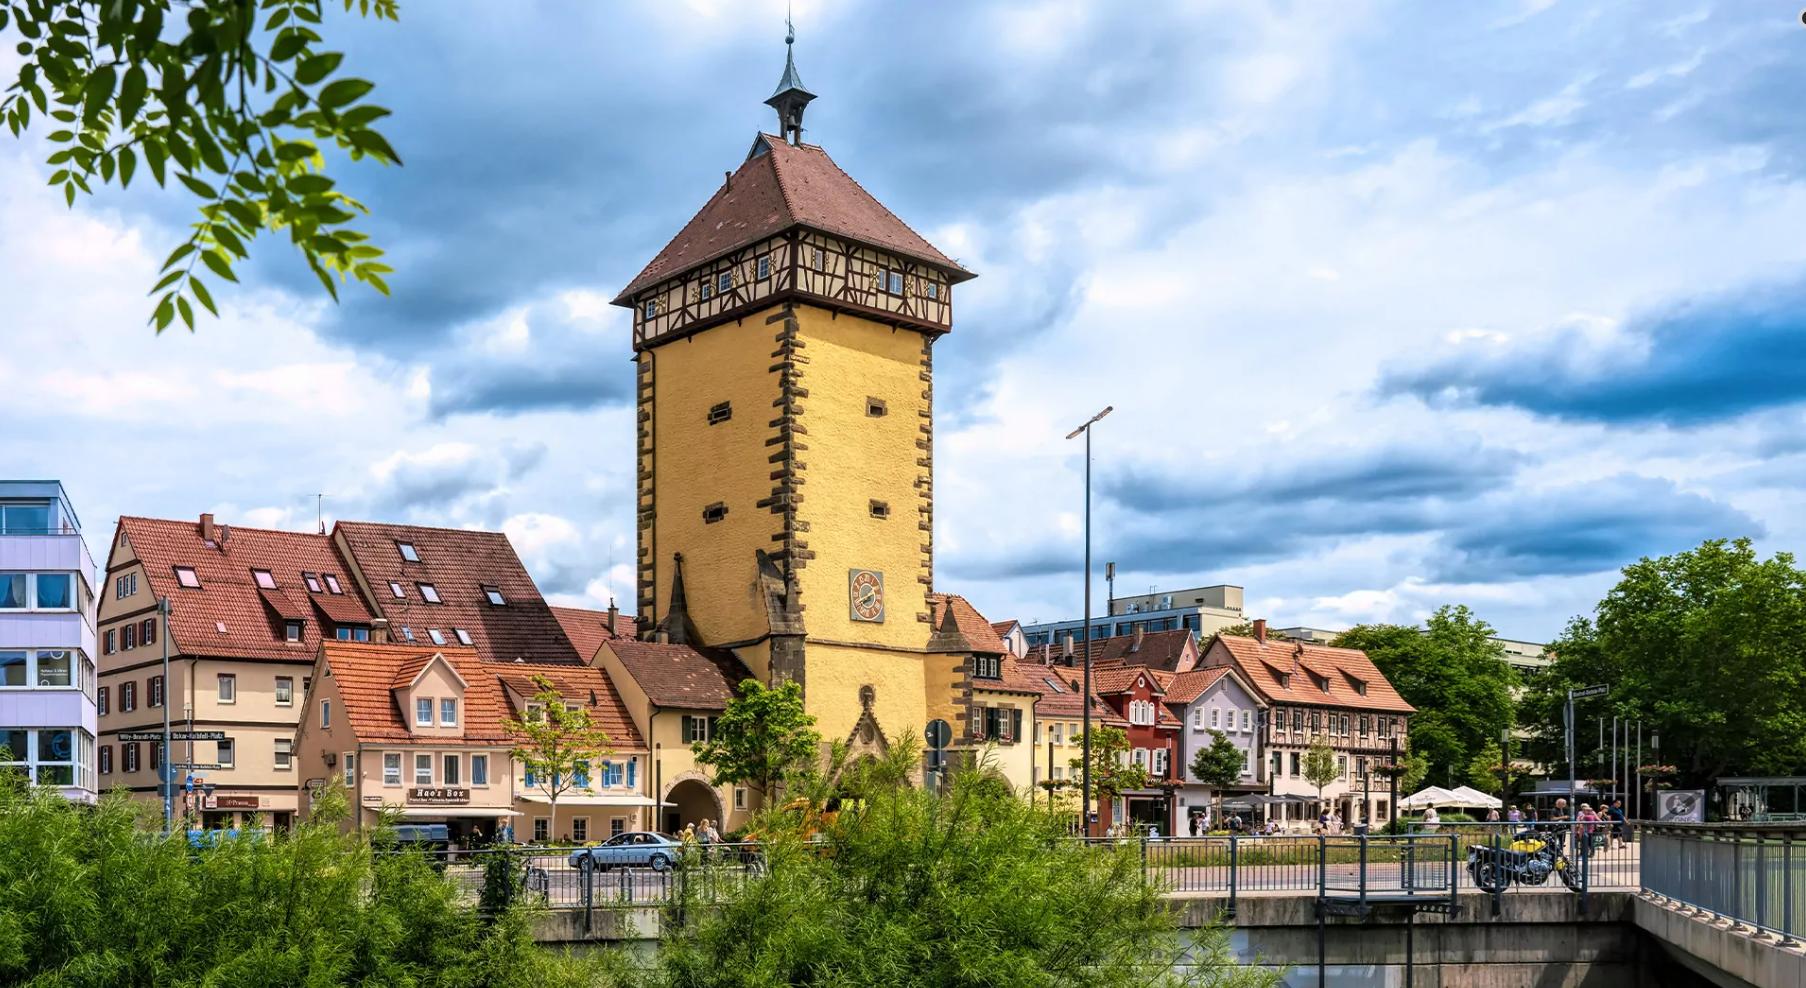
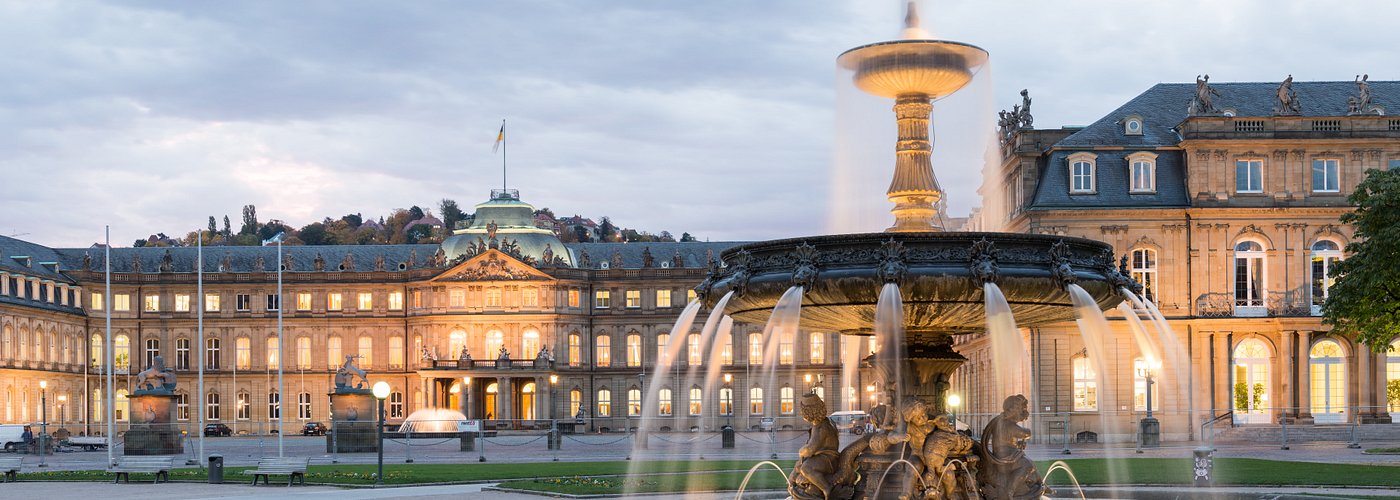
Hi, I’m Luke, or more formally Lukas. I’m a German national with dual citizenship in the US. I was born in Wisconsin, USA but grew up in the greater Stuttgart area (Germany), which is known for its car industry and the Swabian dialect.
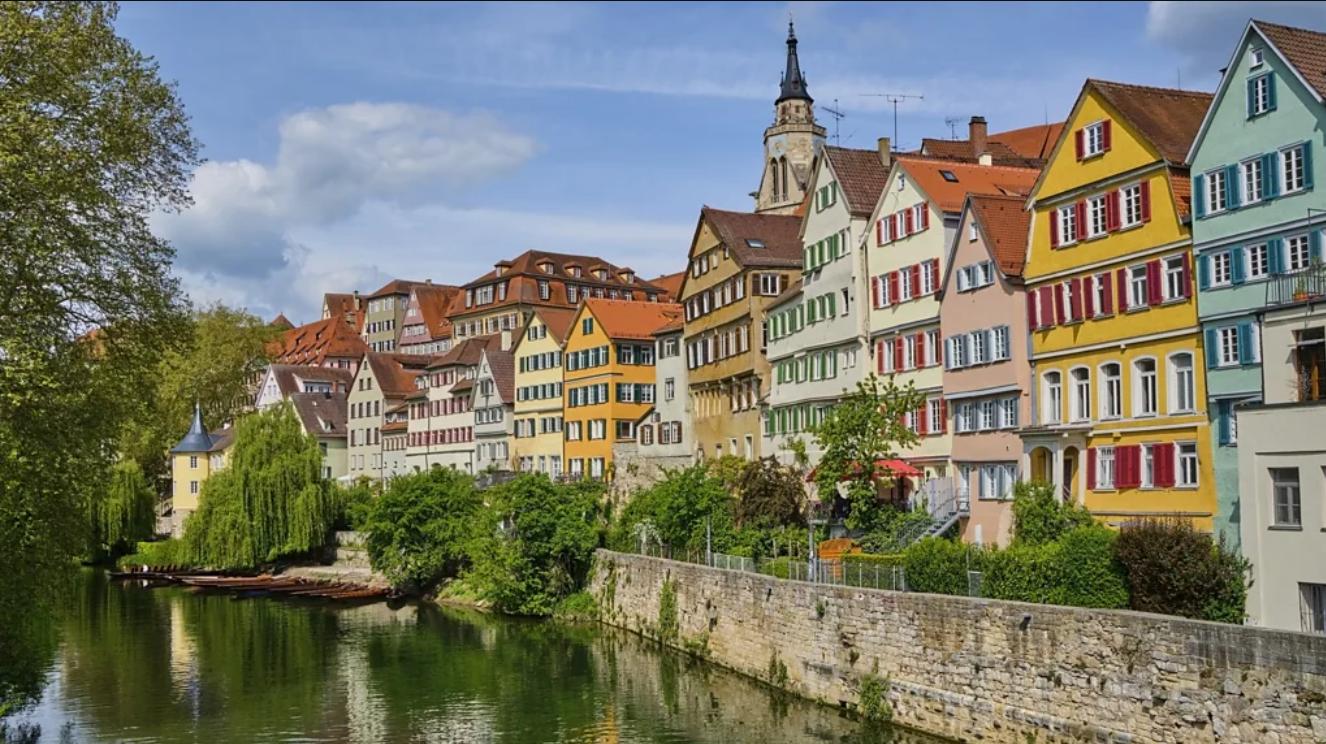
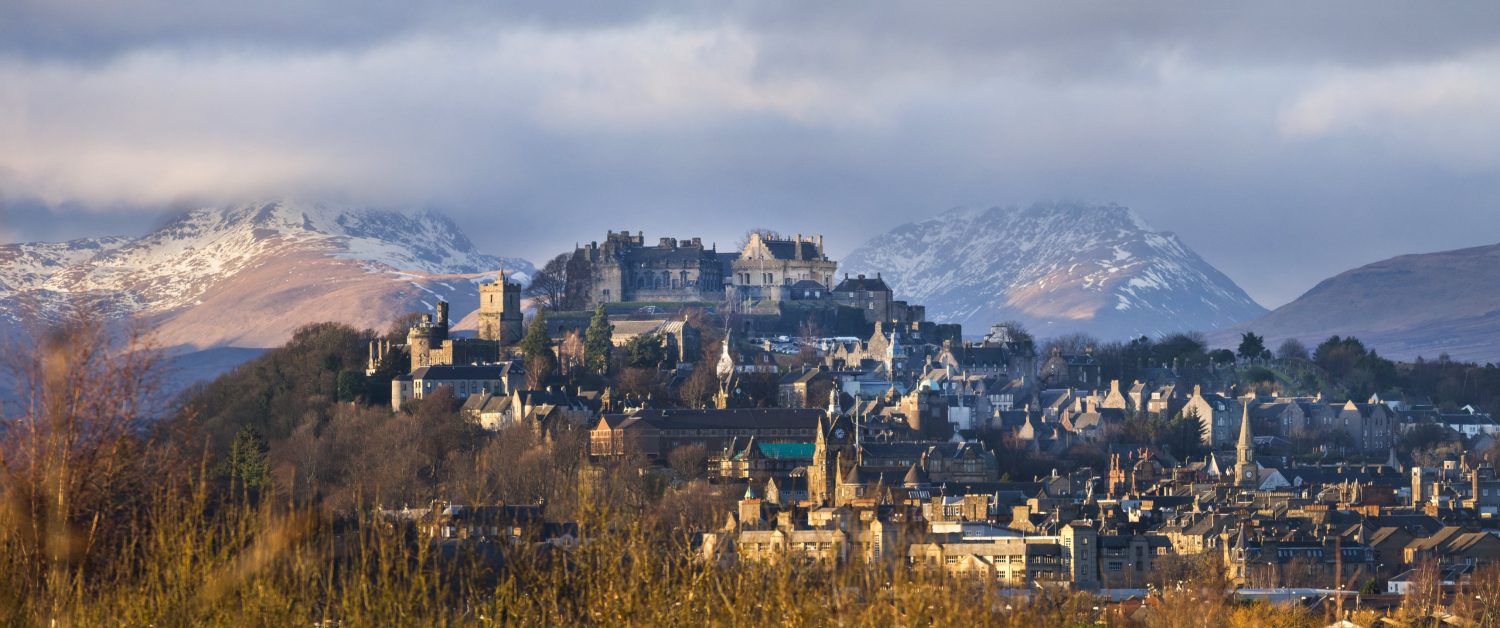
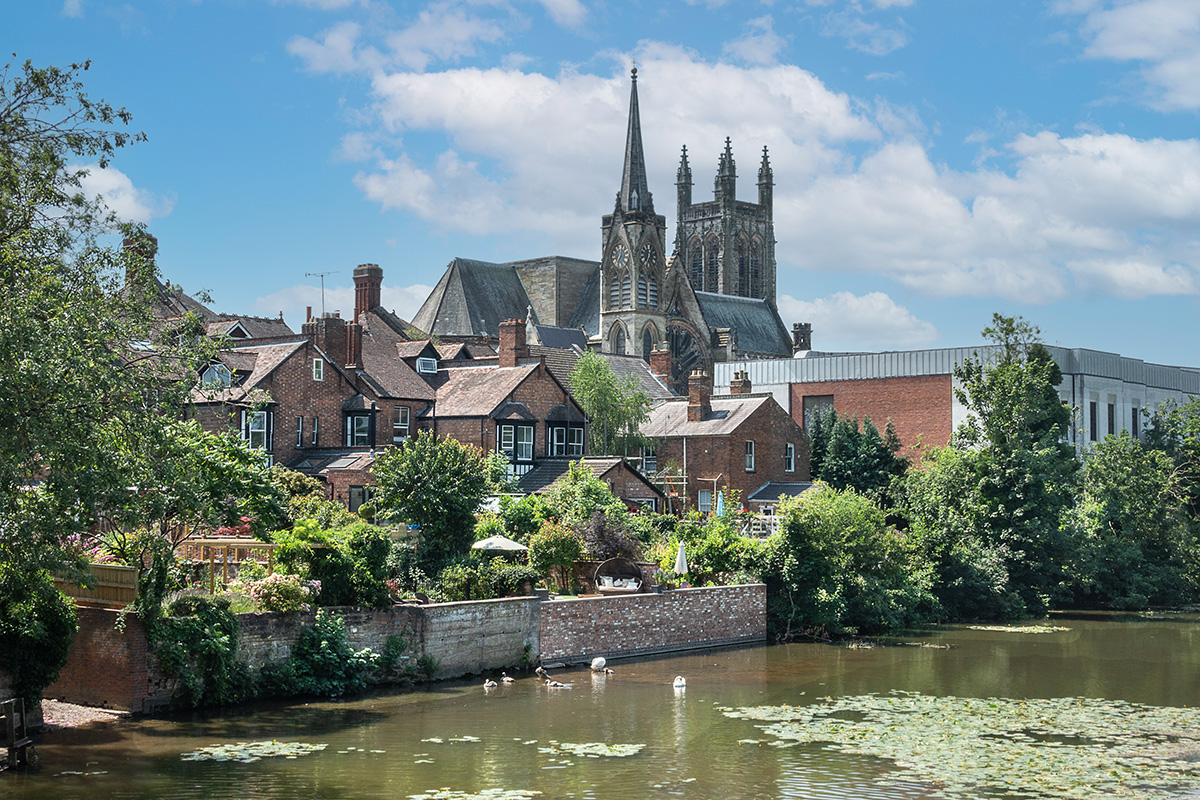
After a brief stint working in a closed psychiatric ward at my local university hospital in Tübingen, I decided to pursue undergraduate education at a small university in beautiful Scotland.
Despite my initial ambitions to pursue a career in clinical psychology, I discovered my analytical side when I was introduced to computer programming by a PhD student in the lab I was helping out in. I got very lucky in this regard as just prior to graduating, I was offered a summer internship at a London-based Data-Science consultancy. I enjoyed the work as it offered diverse problems to solve from different clients, but ultimately I felt that I should also seek formal education in data analytics.
The Behavioral and Data Science M.Sc. at the University of Warwick was very much the perfect fit for me, as it combined my interest in behavioral research with my newfound passion for select topics in Computer Science. It was at Warwick where I first came to appreciate the application of computational modelling to describe cognitive processes. This was when things “clicked” in my head, and I knew that I wanted to pursue a PhD in this area.
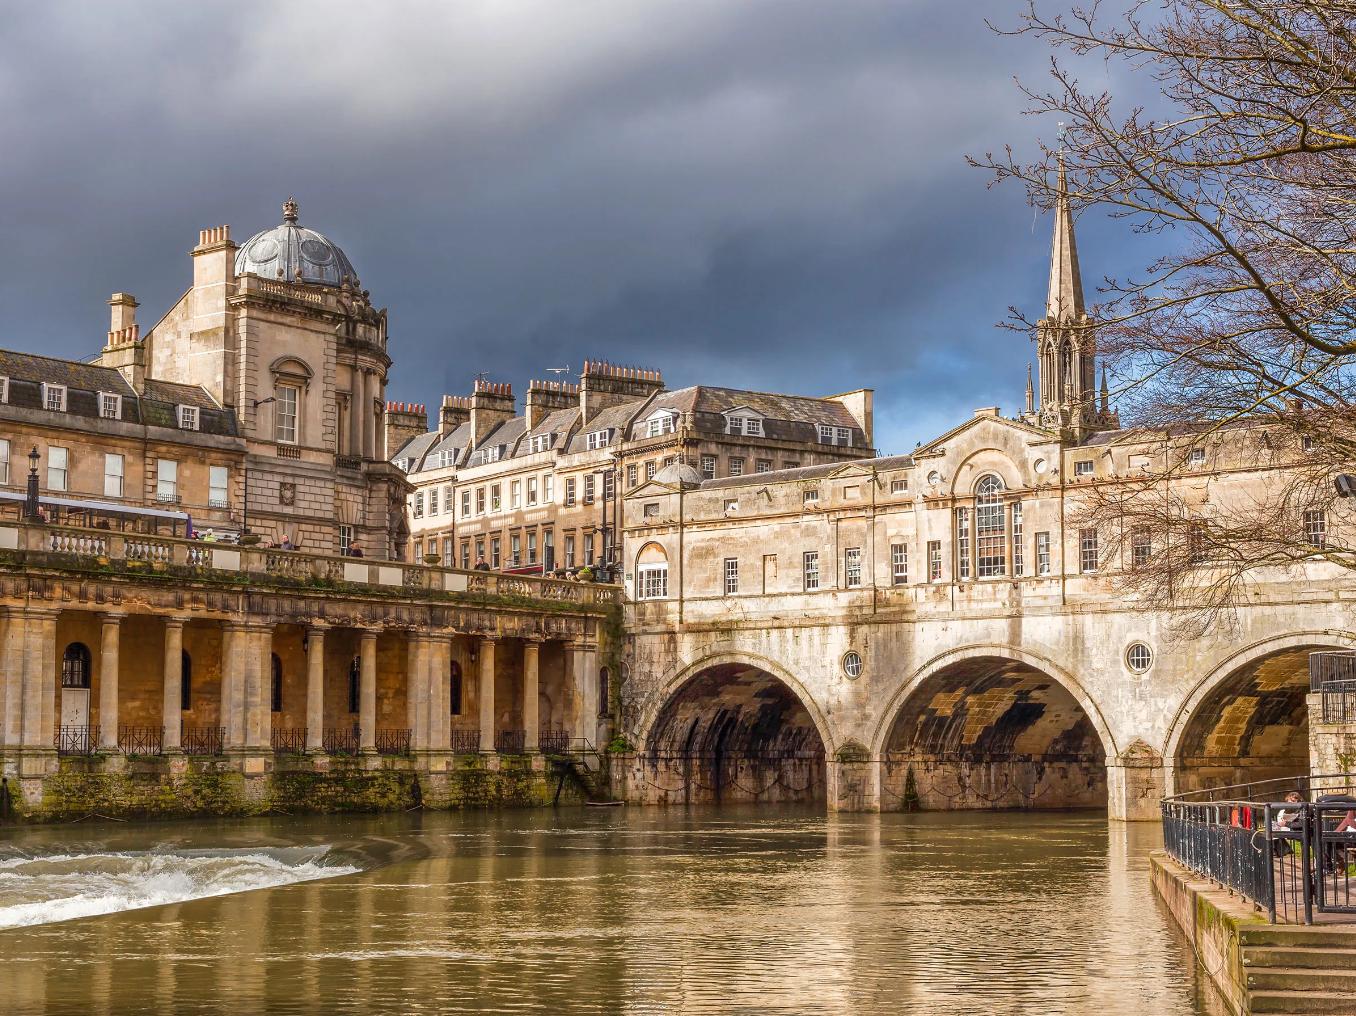
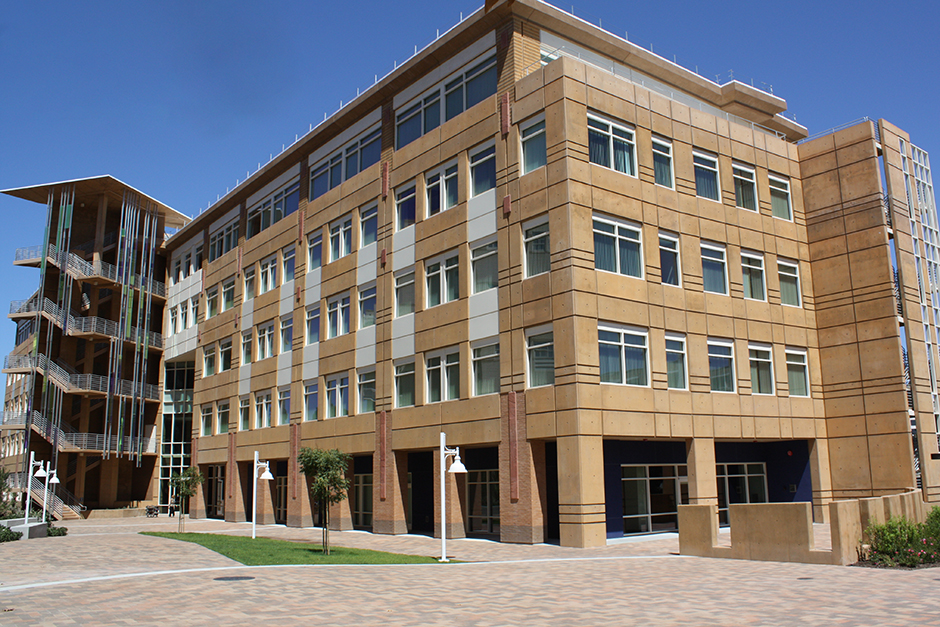
I spent a very fun year working in the Applied Digital Behavior Lab at the University of Bath while preparing my PhD applications and was fortunate to be accepted into the Cognitive Science PhD program at the University of California, Irvine, where I am currently working in Mark Steyvers’ lab.
Bath, England - Credit: Ian Woolcock — Shutterstock